Incentives Update: General Trends
As the C2ER State Incentives update comes to a close, we will begin publishing a series of blogs detailing new insights and findings. This first entry will focus on general trends in the Incentives data. Of particular interest this year, is the status of COVID -19 recovery programs which states are winding down.
As one can see in Figure 1 below, the number of active incentive programs has been steadily decreasing since 2014, with a slight bump between 2019-2020. Presumably, the spike after 2008 can be attributed to recovery efforts after the Global Financial Crisis (GFC). Likewise, the 2019-2020 bump is likely a response to the COVID-19 pandemic and the following decrease may be a consequence of those programs ending.
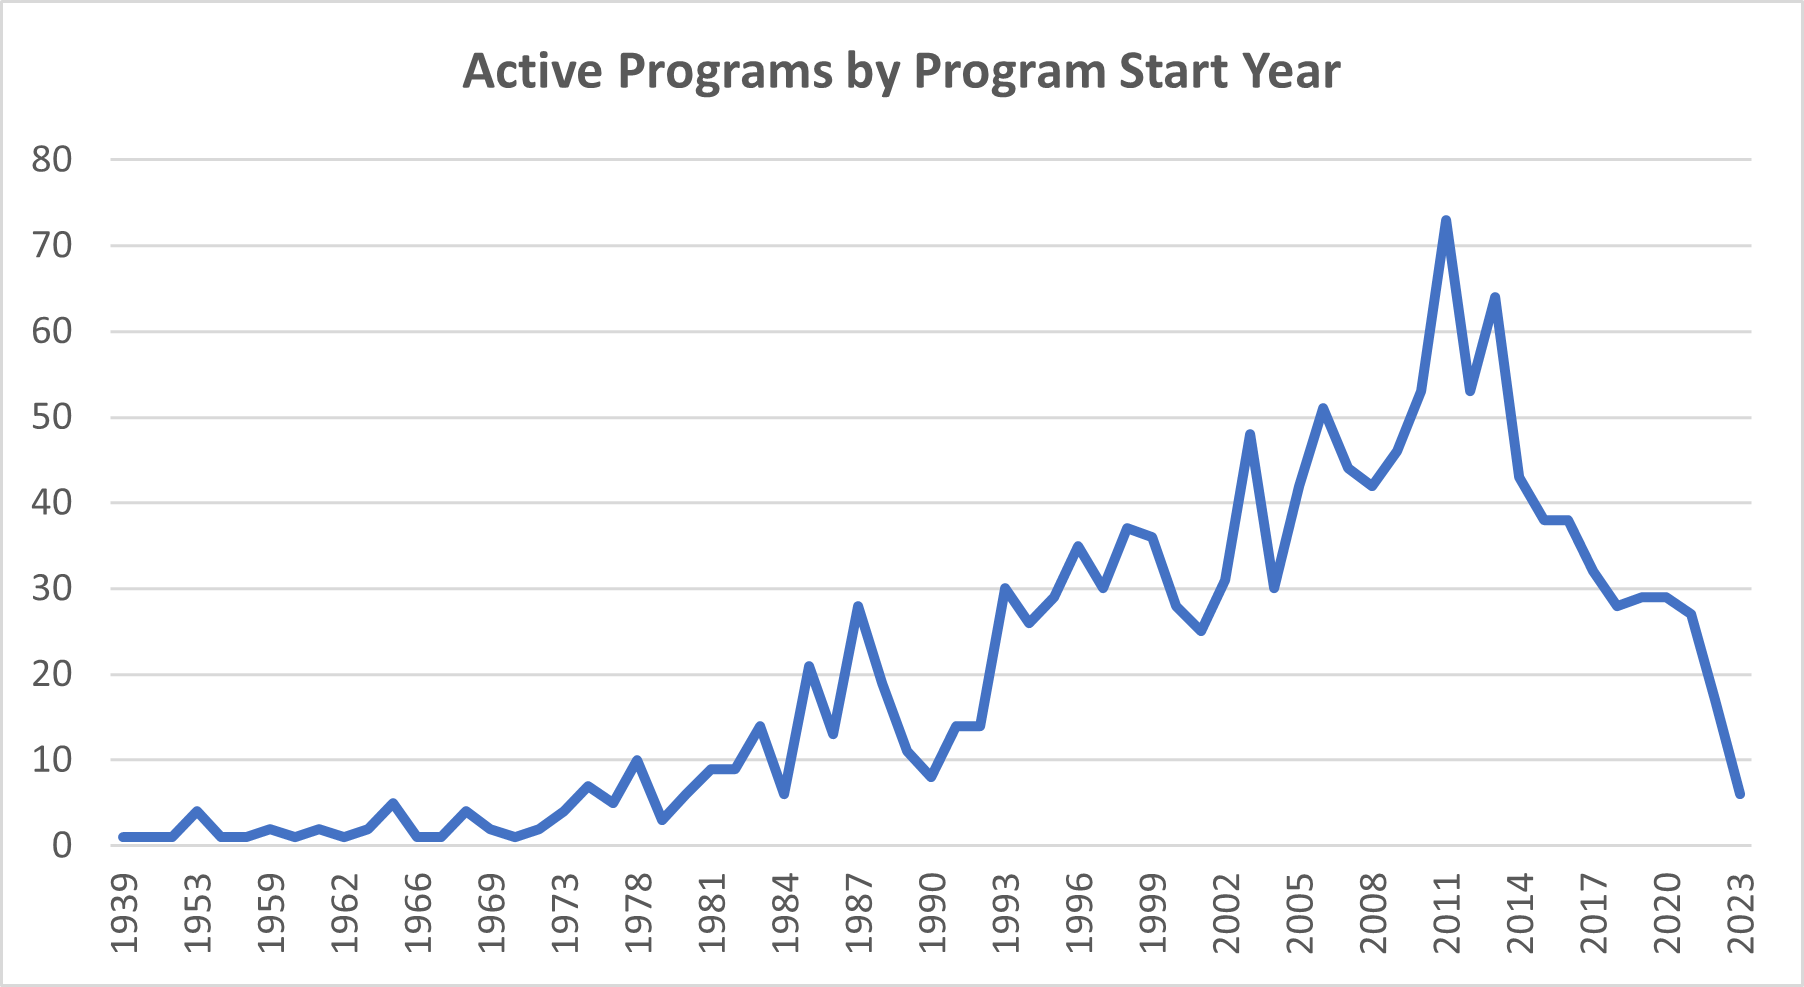
Figure 1
While the number of new incentive programs is decreasing overall, the decrease is not proportional. Indeed, some categories and types of programs are increasing, although the net effect is still negative. When looking at two three-year spans in the figure below, one can see that new loan and equity programs have increased in prominence while new tax and grant programs are less common (Figure 2).
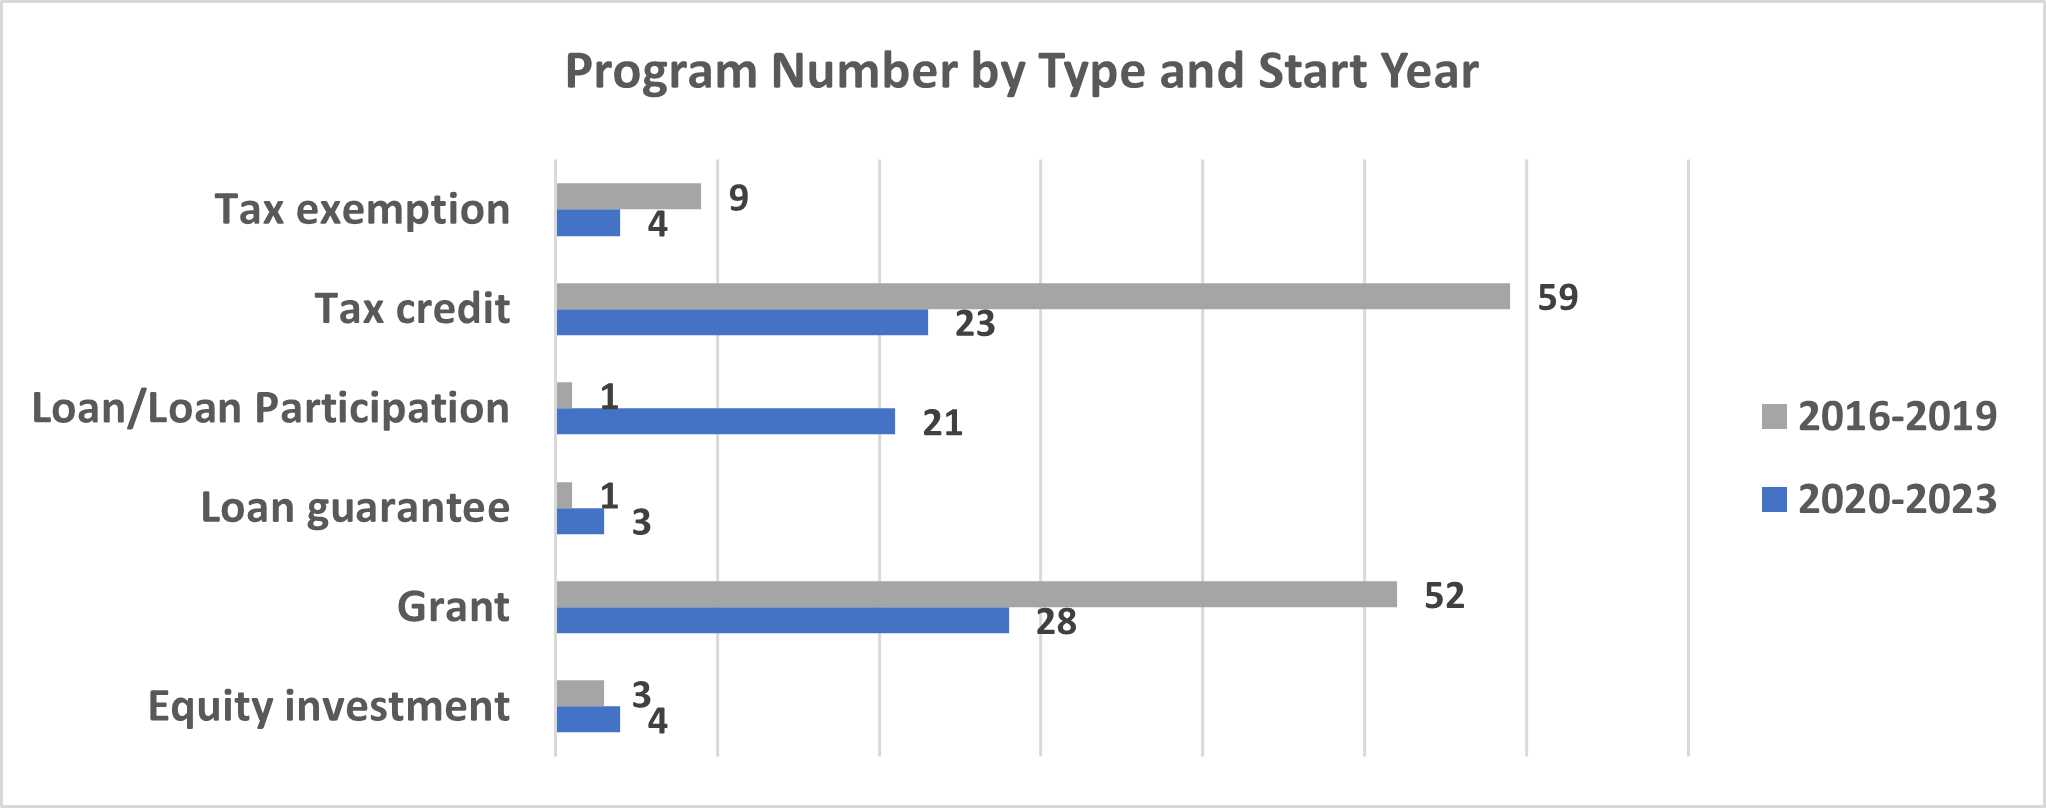
Figure 2
This uneven decrease may be the result of the second iteration of the State Small Business Credit Initiative, launched in 2021. Originally created in 2010, SSBCI is a federal program administered by the Department of Treasury, which injects capital into small businesses through intermediaries like local Community Development Finance Institutions (CDFIs). The capital is funneled into a handful of financial instruments, notably loans and equity support programs. When COVID-19 struck, the Biden administration re-launched the 2010 SSBCI program calling it “SSBCI 2.0”. The funds were deployed through The American Rescue Plan (ARPA, 2021), thus helping to explain the increase in loan and equity programs between 2020 and 2023.
When looking at the needs that incentive programs are designed to address, the same emphasis on debt and equity programs obtains.
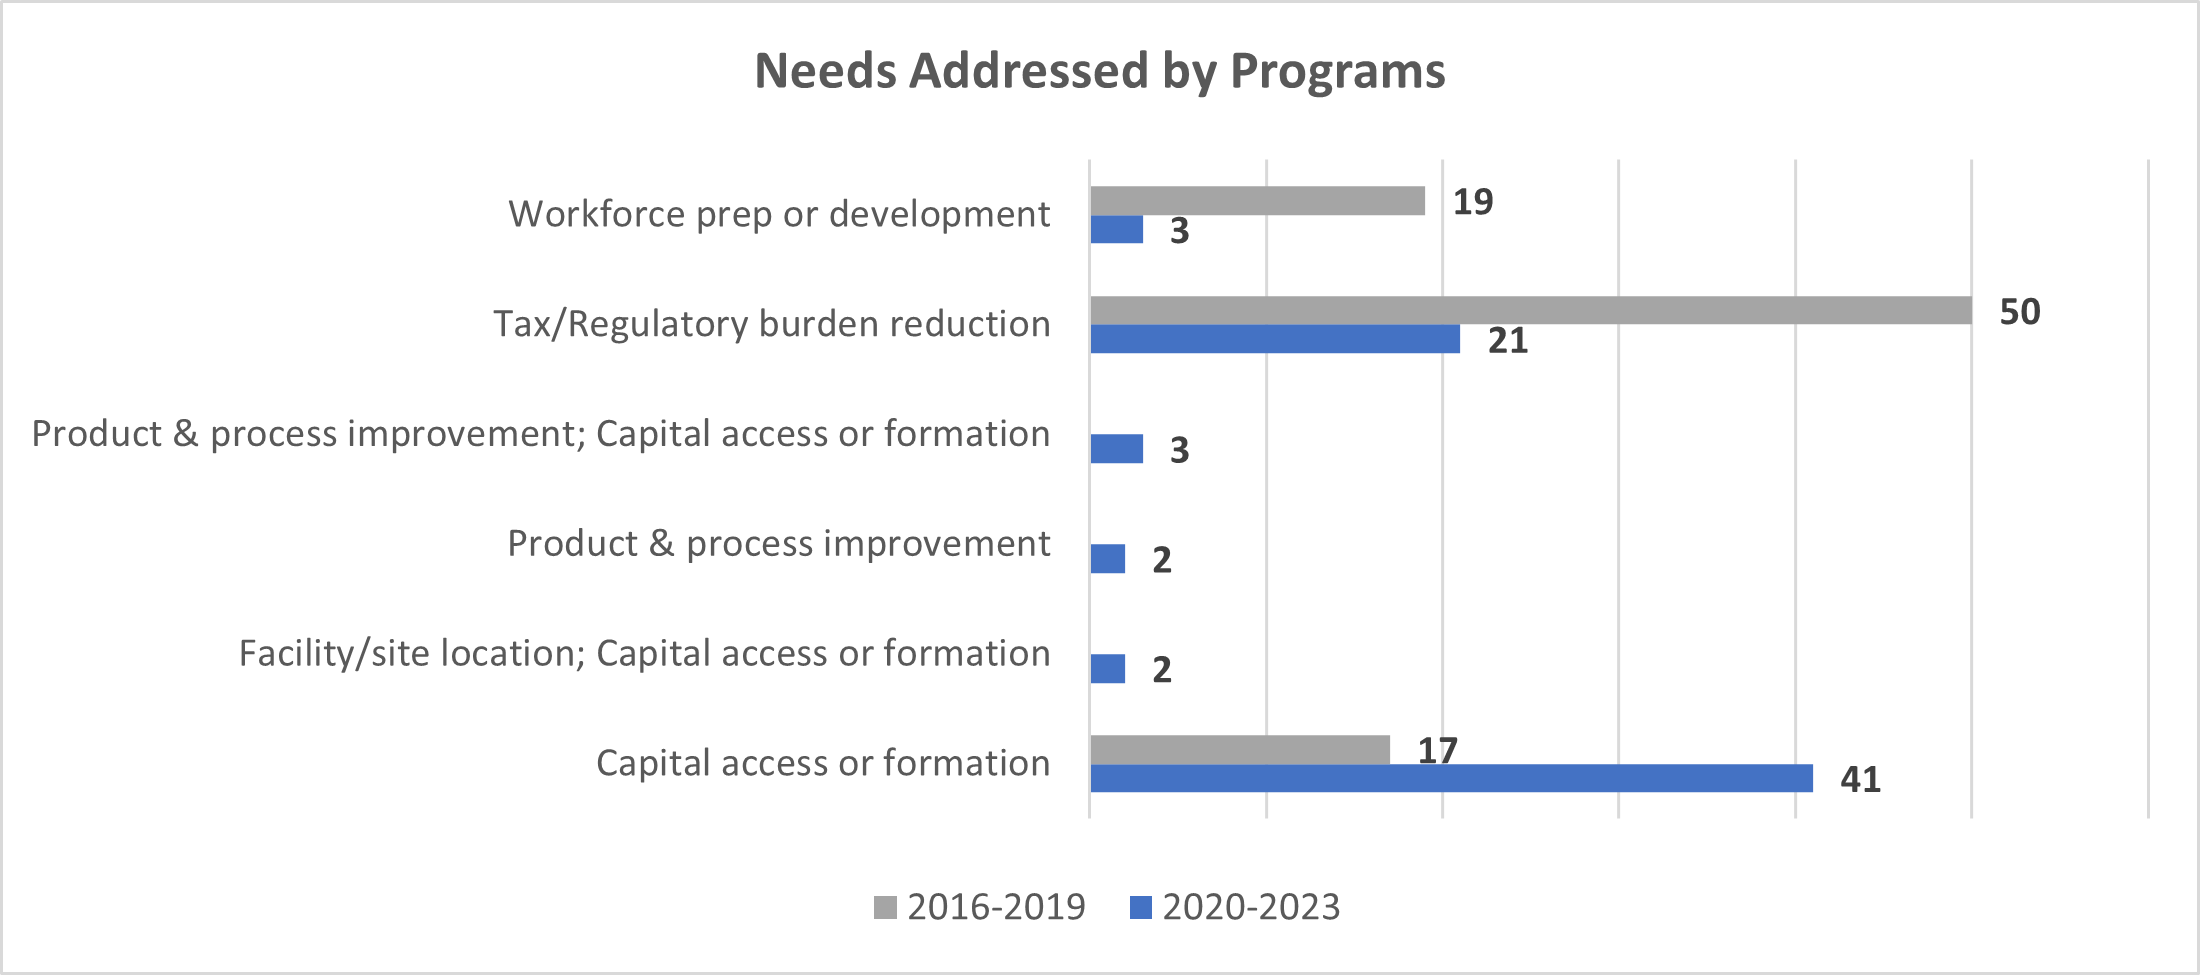
Figure 3
As one can see from looking at Figure 3 above, new capital access programs and capital access-related programs have increased, while there are fewer new programs for workforce and taxes. This shift in program share can also be fairly attributed to the SSBCI 2.0 program.
As program topic foci have changed, so too have regional foci- although not as drastically. One can see in figure 4 (below) that most incentive programs throughout time have been statewide and did not have a particular regional focus. This has been true as far back as incentives data are available. However, one can see a slight uptick in rural and “development zone” specific programs beginning in the 1980s and continuing until 2010-2023. In the period beginning in 2010, non-statewide programs began to compress once again, while statewide programs regained lost ground and urban programs marginally increased. It would be reasonable to assume that this pattern arises from the nature of the economic crises in each of these decades. Where the 2008 GFC impacted specific sectors before tipping the U.S. into recession, the COVID-19 shock was broad-based, mangling goods markets and financial markets alike. Thus, in the 2010-2023 period, programs would begin to shift from specific markets and districts, into broad-based economic support.
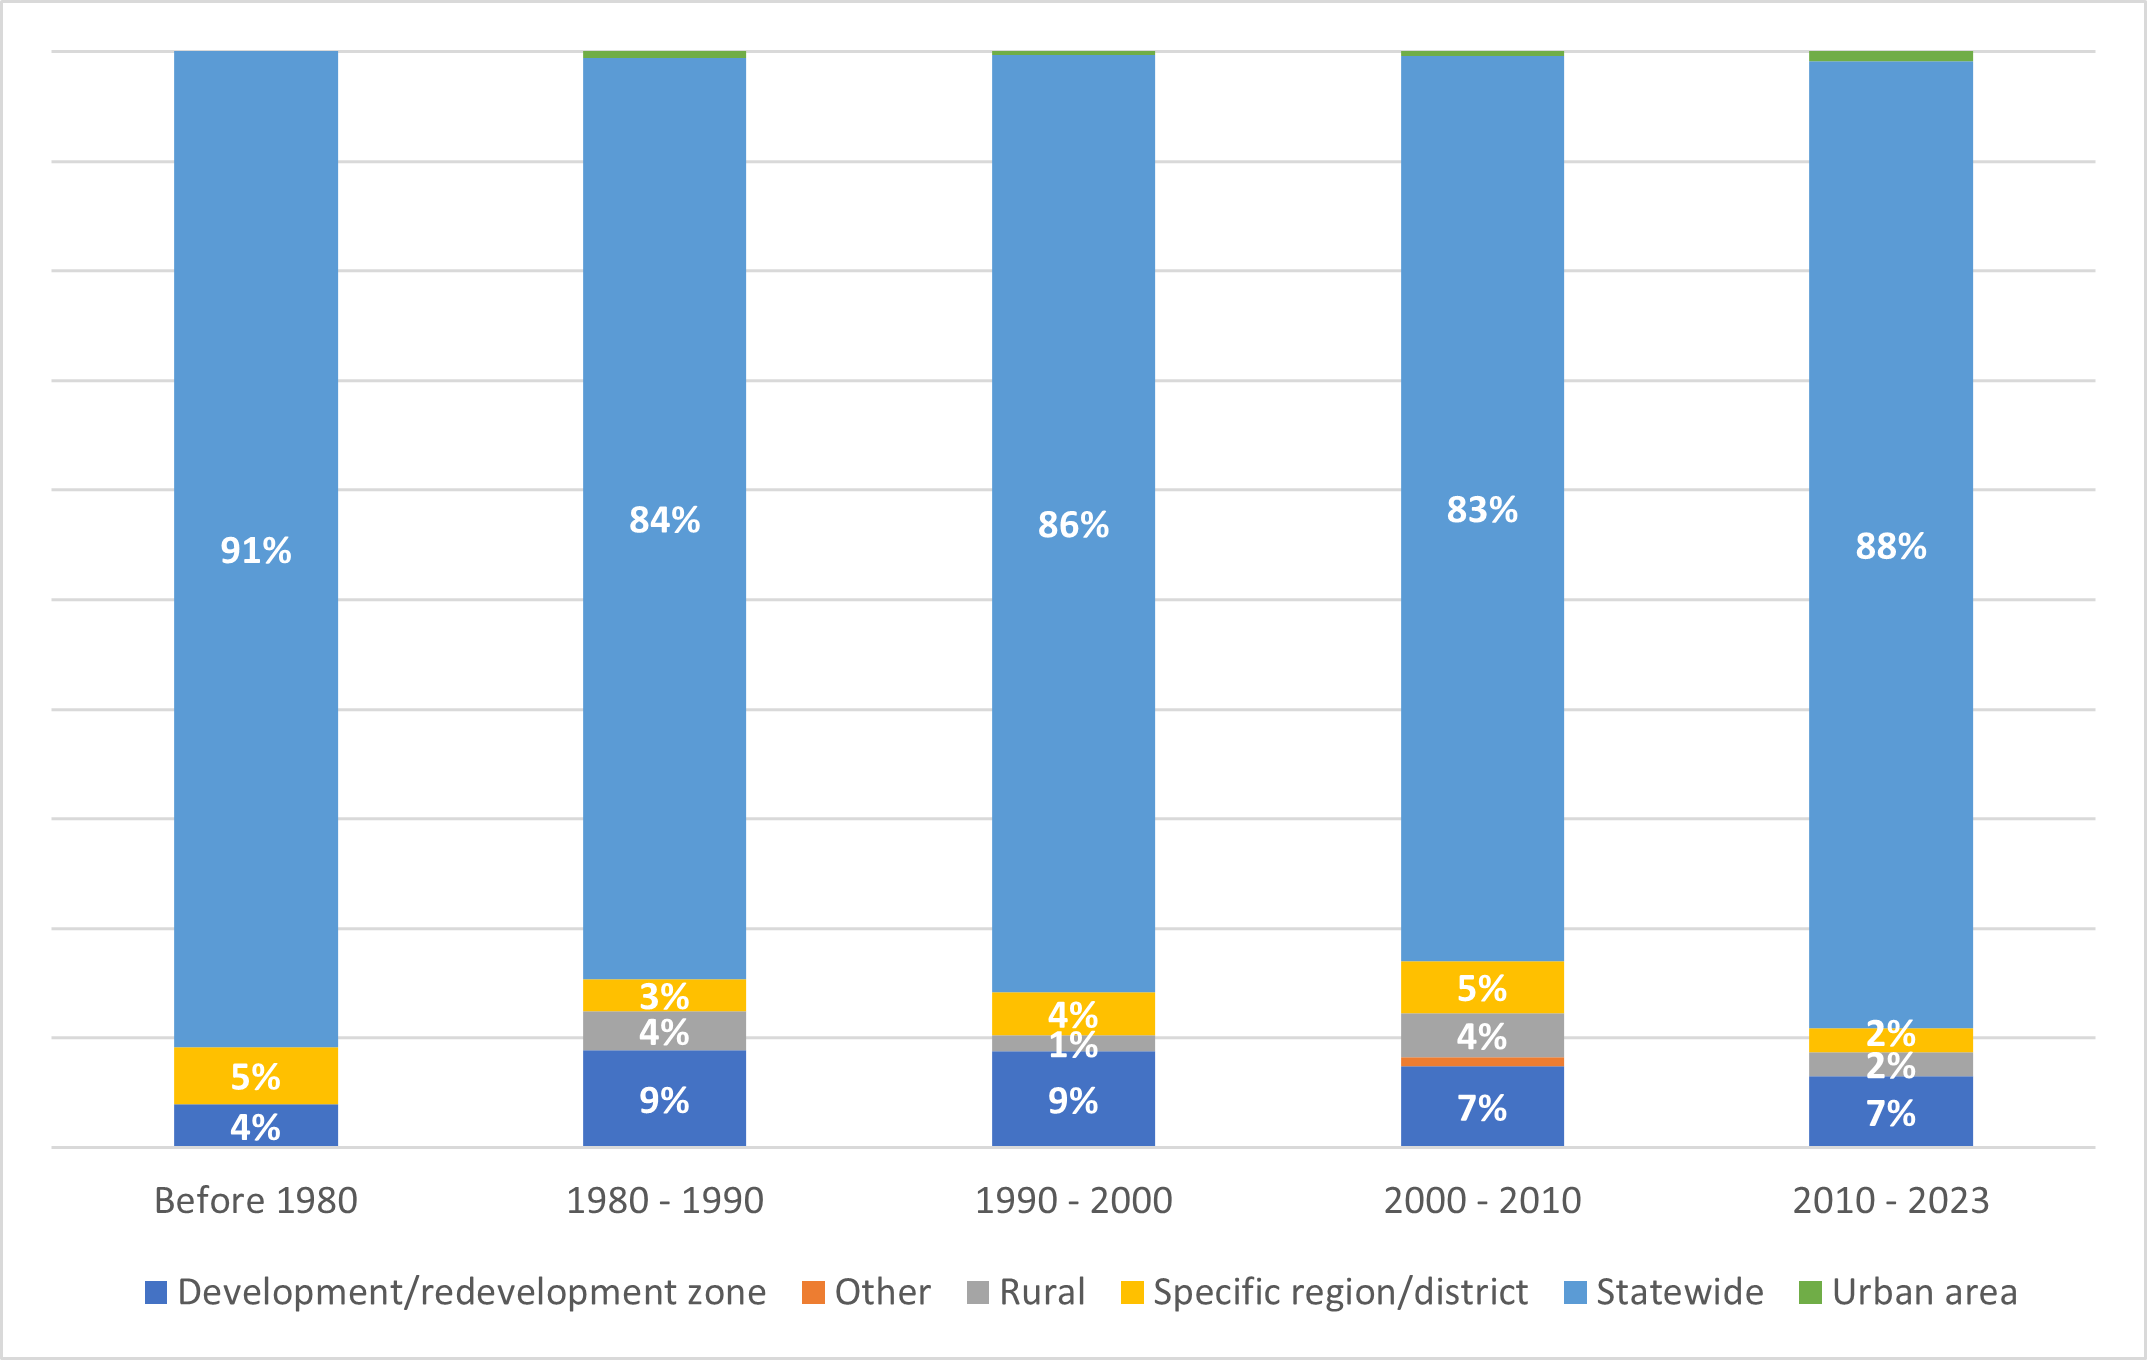
Figure 4
As it stands, one can see incentives programs trending downward in the wake of COVID-19. This could mean a lower level of overall economic assistance as markets return to normal and economic hardships ease. However, as interest rates rise to quell inflation, a recession may be on the horizon. If a recession does emerge, programs may once more adjust to stimulate demand and lend assistance to businesses. Although, the chances of another major stimulus package so soon after the torrent of pandemic recovery spending seems particularly unlikely.