State Incentive Program General Trends
With the conclusion of the State Business Incentives Database summer update, the Council for Community and Economic Research (C2ER) will be publishing a series of blog posts. These blog posts will explore new and topical trends and provide analysis concerning how state incentive programs have changed. This inaugural post focuses on general trends and how programs have shifted over the past year. Of particular interest are the lingering effects of the COVID-19 pandemic and how it continues to shape program type and focus. The analysis of current general trends will be useful to compare to the coming years to see how the Infrastructure Investment and Jobs Act and the Inflation Reduction Act affect state programs.
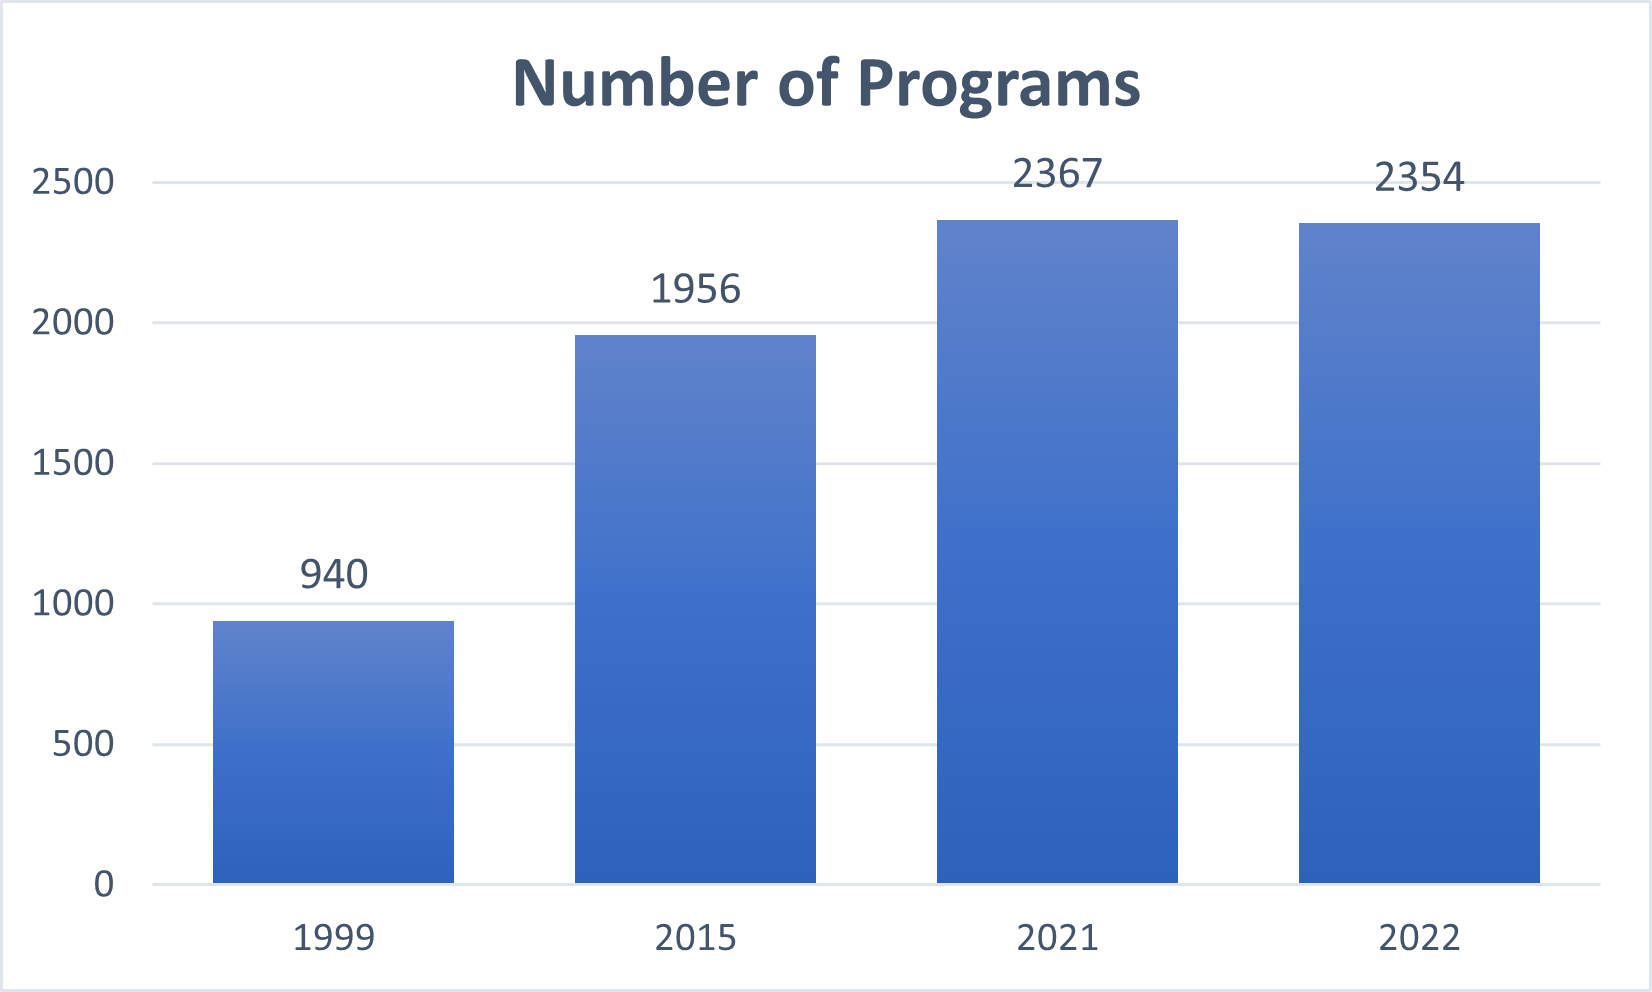
The first major trend concerns the recent decline in total quantity of state incentives programs. As COVID-19 relief programs are beginning to sunset, many states are taking the opportunity to rework their program portfolio. Many programs are being left in limbo until the next cash infusion from the federal government. Additionally, states are not replacing these programs either. Graph 1 shows the number of new programs added each year that are still currently active in the state incentive database. This year, 11 new programs were found, which is considerably fewer than any previous year. The lack of program replacement has resulted in a decrease in total active program, from 2,367 in the summer of 2021 to 2,354 as of today. Graph 2 shows that this is a very minor decrease, with far more programs still on the books than there were in 2015. As this is the first year that shows a decline, it is too soon to say if this is going to be indicative of future trends, or if new programs stemming from federal legislation will result in this being a one-year aberration.
Graph 1: Number of new programs created each year since 1990

Graph 2: Number of programs by year
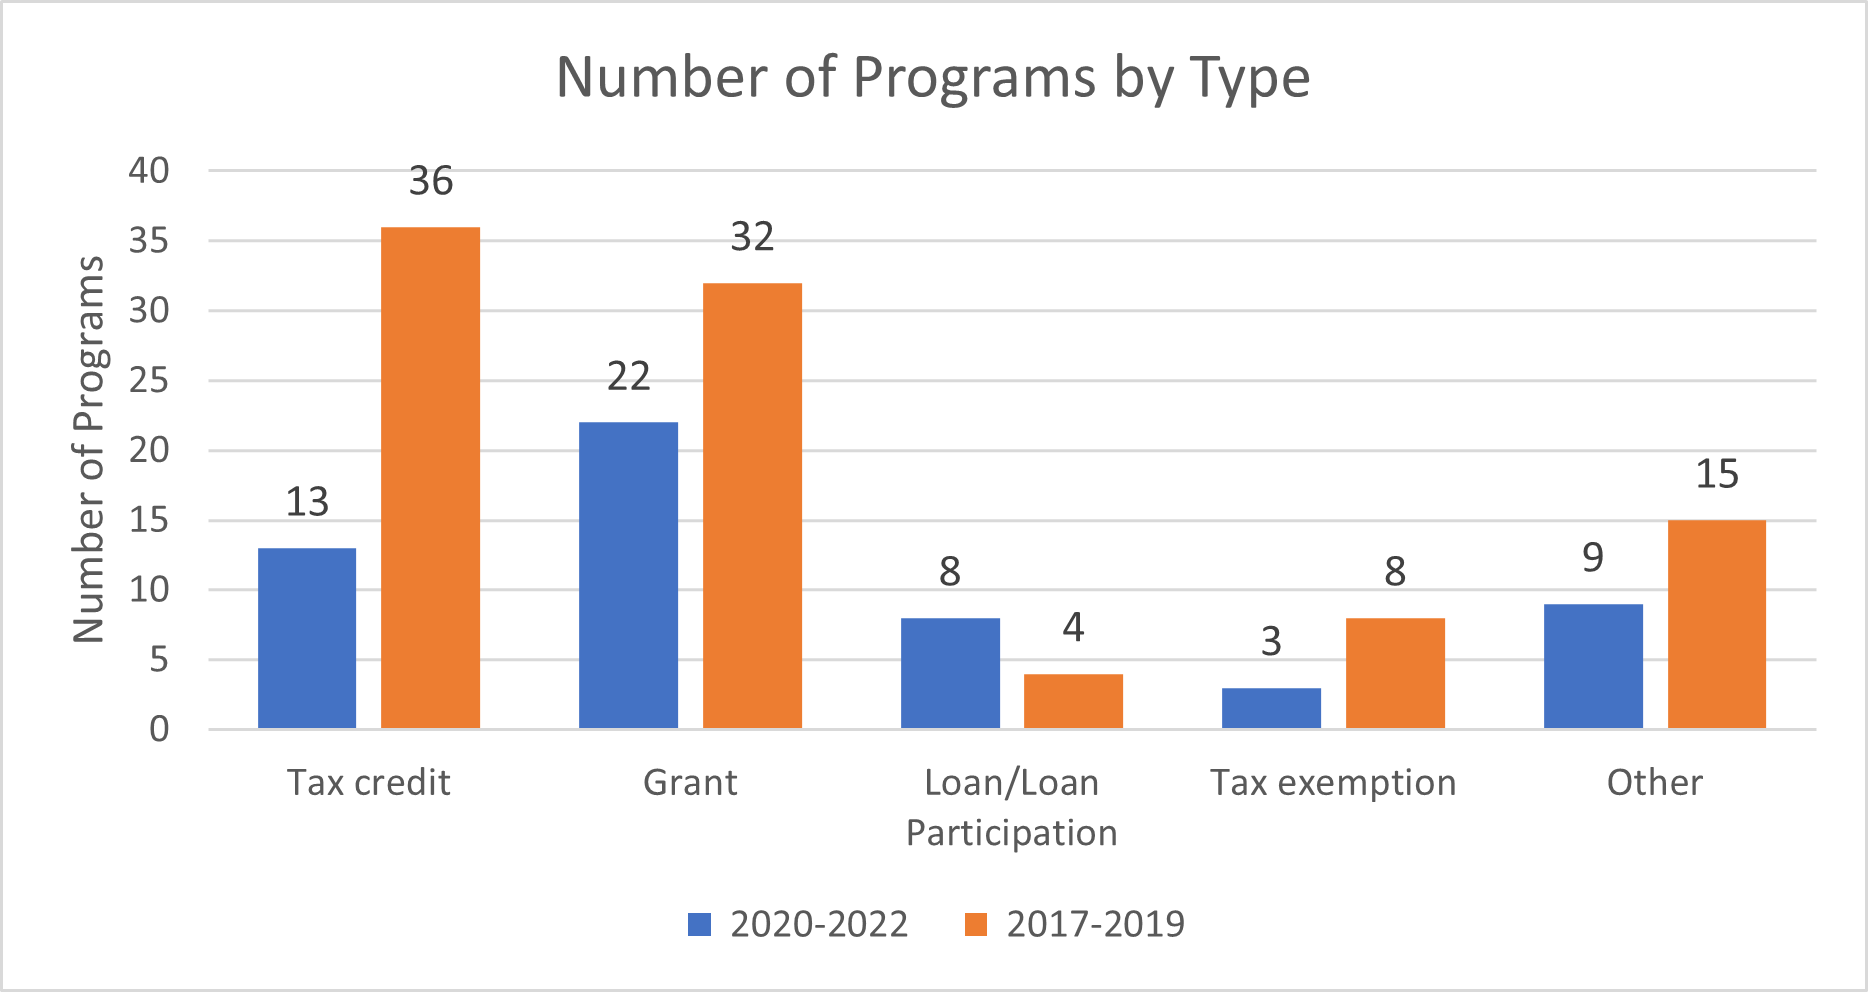
The second recognized major trend is the pivot away from tax-based programs since 2020. Programs can fall into multiple types and categories and address multiple needs. A program that has both a tax credit and grant component will be counted as both for the following analysis. Tax credits are the most common form of incentive in our database, making up roughly 25% of all the programs. Grant programs are the second most popular, making up roughly 22% of the programs. However, recent years have shown this trend changing. While Graph 3 shows that fewer grant programs have been created since 2020 than in the three years prior, the number of new tax credit programs has fallen by much more. Grant programs make up a total of 22 new programs created since the pandemic began, roughly 40% of the overall. In contrast, only 13 new tax credit programs were added, making up a much smaller share of new programs (24%).
Graph 3: Program Types
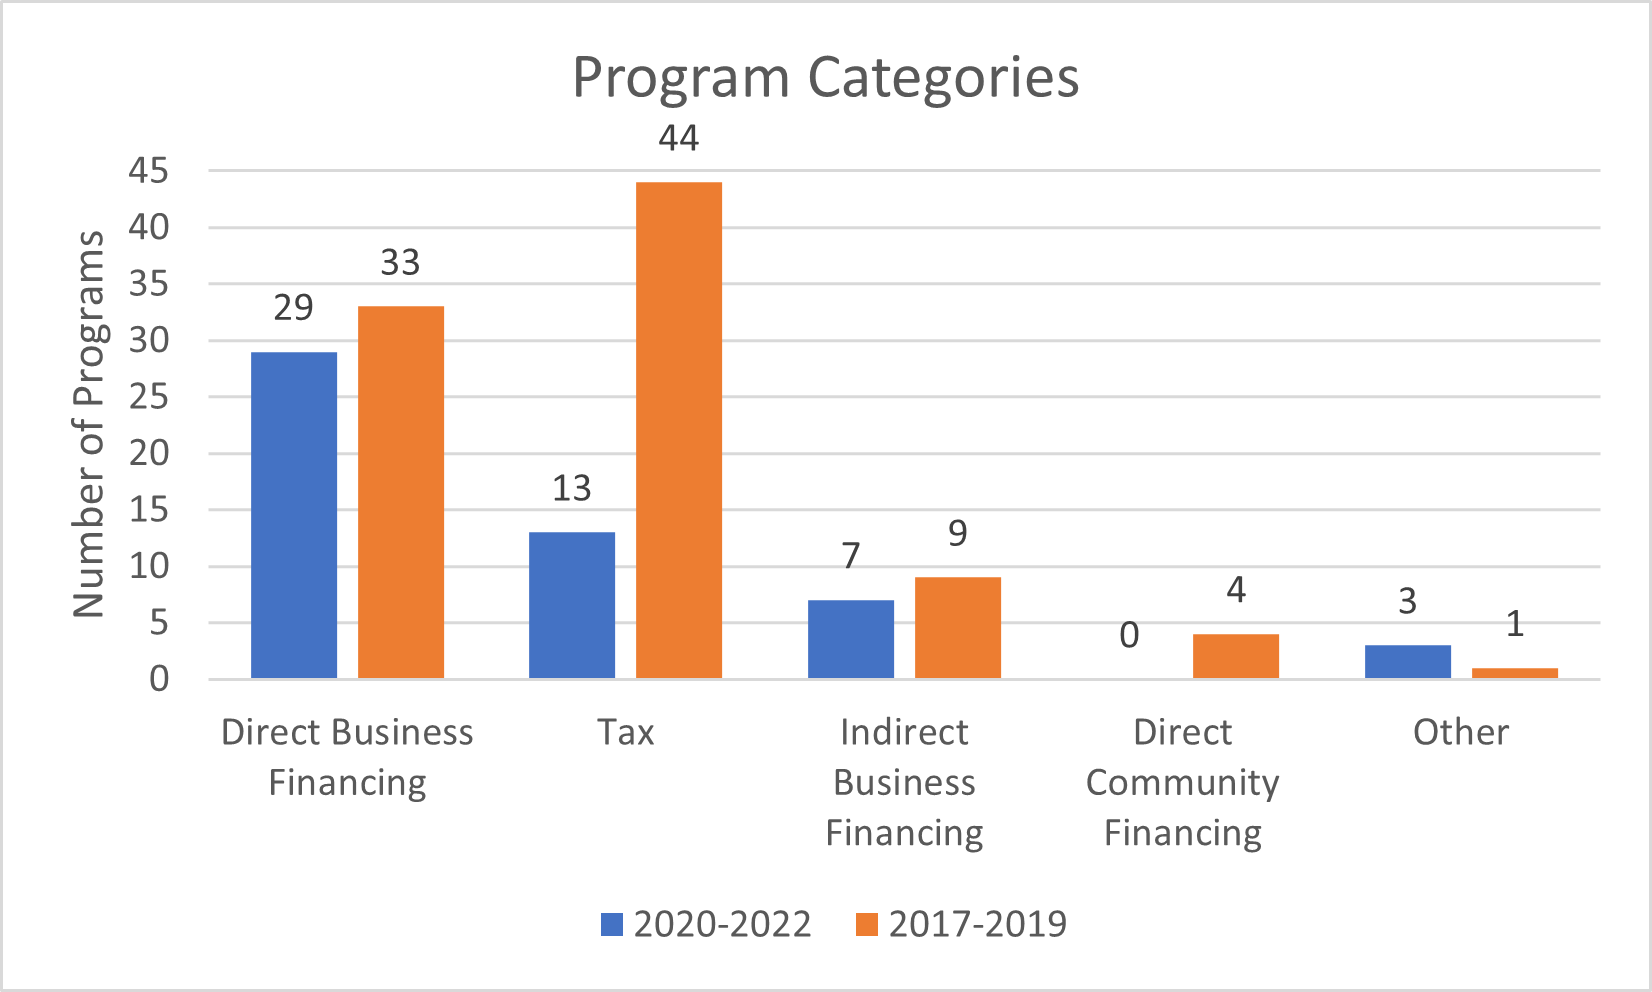
When looking at the broader program categories, the change in new program focus is even stronger. Since the pandemic there has been a dramatic shift from tax programs to direct business financing. Graph 4 shows that only 13 new programs that utilize taxes had been created in the last three years, while 44 were created in the three years prior. Comparatively, 29 programs pointing to direct business financing were created in the past three years. While this is a decrease from the 33 programs created between 2017 and 2019, the program type experienced a proportional increase. Grant programs and direct business programs are increasing at a higher rate than tax-based programs, resulting in the direction of state incentives shifting during the past three years.
Graph 4: Program Categories
This shift in program types and categories is not just regulatory, but indicative in what needs are being addressed by new state incentives. Graph 5 shows that states have shifted from tax and regulatory burden reduction to capital access funds. While fewer total programs addressing capital access needs were added since the start of the pandemic, they make up roughly 36% of the new programs. In contrast, only 13 new programs addressing tax and regulatory burdens were added, making up a much smaller share of 19% of new programs. This shows a shift in both desired outcome of state incentive programs as well as a shift in strategy.
Graph 5: Program Needs

Looking to the future, we will see if these trends continue after the passage Infrastructure Investment and Jobs Act and the Inflation Reduction Act, or if this was an outlier deviation caused by waning of the COVID-19 pandemic and sunsetting of programs created to specifically address the outbreak. If we continue to see a rise in grant programs, direct business financing programs, and programs addressing capital access we will know that a longer-term shift has been made, and not just emergency adjustments.