Tag: incentives

  • State Incentives: SSBCI Program Recap and Overview

    State Incentives: SSBCI Program Recap and Overview

    In 2010, President Obama signed into law the Small Business Jobs Act, which created the State Small Business Credit Initiative (SSBCI). Functioning as a recovery response to the Great Recession, it delivered $1.5 billion in capital to small businesses. Federally, SSBCI phased out in 2017.

    Nevertheless, after more than a decade, many of the same original SSBCI programs still exist, suggesting that states value them. In the wake of the COVID-19 pandemic, similar economic challenges to the Great Recession emerged. President Biden signed the American Rescue Plan Act in March 2021 to deliver immediate and direct relief to families, businesses, and workers impacted by the COVID-19 crisis, part of which reauthorized SSBCI.

    A Continuation of the Trends

    The 2021 bill allocated $10 billion to SSBCI, which is a sizeable $8.5 billion more than the amount authorized in 2010. Based on a 2016 SSBCI program evaluation[1] conducted by Center for Regional Economic Competitiveness (CREC), this could mean significant economic benefits for states. The CREC report highlighted that SSBCI programs expended $1.04 billion, supporting “nearly $8.4 billion in new capital in small business loans and investments by the end of 2015.” The very next year the Congressional Research Service calculated SSBCI participants leveraged $8.95 in new financing for every $1 in SSBCI funds[2] a significant return on investment.

    Moreover, the Great Recession and COVID-19 both substantially impacted very small businesses. SSBCI aims to fund all small businesses, but 80 percent of transactions involved very small businesses of 10 or fewer employees in the original authorization. The American Rescue Plan now codifies this trend by requiring $500 million to specifically fund very small businesses.

    What’s new?

    Given the good return from SSBCI 1.0, if states are well-coordinated with their strategic plans, then they should have an even better outcome for SSBCI 2.0. Through its first action, the U.S. Treasury Department distributed $6.5 billion of the preliminary allocation by formula to states. Other funding is set aside for designated purposes: $500 million for technical assistance, $500 million for tribal governments, $1.5 billion to socially and economically disadvantaged businesses, and $1 billion will be kept to award states that perform well using SSBCI.

    As with many new federal funding initiatives, SSBCI 1.0 experienced bumps along the road. Capital access programs experienced difficulties getting significant quantities of funds out the door because small loan sizes meant that it took many more loans to lend the same amount as other programs. Collateral support programs encountered issues in generating sustainable revenues because they tended to take longer to recycle. However, in tandem with the experience gained by the states, technical assistance funds may be an important mechanism for helping to smooth the path going forward. Funding for socially and economic disadvantaged businesses as well as tribal communities helps address the traditional disparity in capital access for these groups.

    The Current State of SSBCI

    CREC has been following the SSBCI 1.0 programs since it was phased out in 2017. At that time, some states reallocated their SSBCI funding to other activities. States continue to operate slightly less than half of those programs some four years later. Of the five major program types, states were more likely to keep loan participation programs. Close to half of those programs are still active. It is likely that the newly authorized funding will be built from this foundation based on preliminary planning reports from the states.

    Through these existing programs, states already have a solid foundation for the next round of SSBCI. Several states have maintained all SSBCI programs including Idaho, Illinois, Kentucky, Maine, Delaware, Maryland, Massachusetts, Mississippi, New York, Ohio, Oklahoma, Oregon, South Carolina, and Vermont. All original programs are inactive in Arizona, Connecticut, Hawaii, Michigan, Montana, New Hampshire, North Dakota, Wisconsin, and Wyoming. We expect to see an influx of new financing programs from SSBCI 2.0, especially in the states where either all or some programs are inactive.

    The map below indicates the number of still active SSBCI programs and the preliminary allocations states have received by formula. Access the C2ER State Incentives Database to stay up to date on what SSBCI programs are available. To get a preview of notable programs from SSBCI 1.0 by program type, read the case studies under the graphic.

    Click here to access the interactive SSBCI 2.0 map

    Case Studies

    California Capital Access Program

    California SSBCI 1.0 Allocation: $168 million

    CalCap Allocation: $19.5 million

    California SSBCI 2.0 Allocation: $892 million

    California received an allocation of $168 million from 2011 to 2017. The state split the funds between its collateral support (CalCSP) and capital access program (CalCap). CalCap emerged as the state’s shining star during SSBCI 1.0. While only $19.5 million of the $168 million (11 percent) went to CalCap, the program generated over $337 million in new financing. That translated into $22.19 in private lending for every $1 of SSBCI leveraged.[3] Capital access programs rely on enrolling many loans continuously and pooling contributions to create a reserve fund to recycle funds and protect against default by borrowers. The Opportunity Fund, a CDFI and frequent user of CalCap, dispersed 8,754 loans to small businesses by 2018, aiding in the program’s immense success.[4] These loans, 91 percent of which were granted to minorities, assisted small businesses of all types, ranging from street vendors to family-run restaurants.[5] Going into SSBCI 2.0, CalCap still operates and will probably be an important contributor to SSBCI 2.0.

    Florida Venture Capital Program

    Florida SSBCI 1.0 Allocation: $98 million

    FVCP Allocation: $26.5 million

    Florida SSBCI 2.0 Allocation: $324 million

    Florida’s venture capital program, managed by the Florida Opportunity Fund, offers equity investments and convertible debt instruments to emerging Florida companies, particularly those with long-term growth potential. The programs website indicates that “through June 30, 2019, the FLVCP completed 19 investment commitments, and there are active investments in 15 companies.”[6] According to the National Bureau of Economic Research, businesses in their adolescence with potential for high growth have significantly positive effects to job growth and regional economies.[7] In 2013, the earlier years of SSBCI, Florida invested all venture capital SSBCI funds into companies in their seed/early stages.[8] Over the past few decades, venture capital funds have slowly transitioned to disproportionately concentrating in specific metro areas. In 2015, close to 80 percent of all venture capital went to businesses in San Francisco, Los Angeles, New York City, and Boston.[9] SSBCI 2.0 will hopefully break geographic concentrations down and distribute business expansion evenly. As programs like these grow, they have the potential to break through equity capital barriers in so-called flyover states.

    Michigan Collateral Support Program

    Michigan SSBCI 1.0 Allocation: $79 million

    MCSP Allocation: $44 million

    Michigan SSBCI 2.0 Preliminary Allocation: $176 million

    Among all program types, collateral support programs struggled the most to generate sustainable income streams. Michigan stood out at the front of the pack, however, by making this model work and recycling funds at an exceptional rate. The program rests on the rationale that the financial sector woefully undervalues equipment and other assets as collateral. This is especially true with hard-to-liquidate fixed assets such as specialty equipment or unique real estate properties. Collateral support helps to “boost the value” of the collateral by providing a cash asset to guarantee the fixed asset’s collateral value. Michigan’s program provided a model that 16 other states followed[10] and is still active today, playing an important part in financing companies during the pandemic. In 2020, the program helped 100 companies, opened 300 new jobs, and helped maintain 1,500 other jobs.[11] Michigan clearly values this program, since it continued well after the sunset of SSBCI 1.0 in 2017. New funding will permit Michigan to further showcase why its collateral support program is a model for other states to follow coming out of COVID-19.

    Alabama Loan Guarantee Program

    Alabama SSBCI 1.0 Allocation: $31 million

    ALGP Allocation: $27 million

    Alabama SSBCI 2.0 Preliminary Allocation: $56 million

    The Alabama Loan Guarantee Program helped form partnerships between the state and community banks. Community banks have a pulse on the needs of the business community, so consulting with them optimized the use of funds. Prior to SSBCI, Alabama had no credit-support programs for small business.[12] Marketed as an easier, cheaper, and more inclusive alternative to SBA, lenders and borrowers alike benefitted from the program, resulting in 568 transactions.[13] Alabama expended all the program’s funds by 2016 but continues to operate it with recycled funds. The state’s SSBCI 2.0 allocation provides resources that could help reinvigorate the program.

    Advantage Illinois Loan Participation Program

    Illinois SSBCI 1.0 Allocation: $78 million

    AILPP Allocation: $70.5 million

    Illinois SSBCI 2.0 Preliminary Allocation: $282 million

    Advantage Illinois Loan Participation Program assists many business types, with a focus on minority-, women-, disability-, and veteran-owned businesses by purchasing subordinated loan participation at below market interest rates.[14] Furthermore, the program allows funding to be used for a wide range of purposes. The flexibility, inclusivity, and favorable characteristics of the loan made it a highly popular program. The program made up 87 percent of total SSBCI funds the state expended, totaling in 200 transactions that leveraged $8.65 for every dollar.[15] The program continued operating throughout the pandemic and could be an important part of Illinois’ future plans.

    [1] Program Evaluation of The US Department of Treasury State Small Business Credit Initiative, Arlington, VA: Center for Regional Economic Competitiveness, 2016), https://www.treasury.gov/resource-center/sb-programs/documents/ssbci%20program%20evaluation%202016%20-%20full%20report.pdf.

    [2] State Small Business Credit Initiative: A Summary of States 2016 Annual Reports, Washington D.C.: Department of the Treasury, 2017, https://home.treasury.gov/system/files/256/SSBCI-Summary-of-States-Annual-Report-2016_508-Compliant.pdf.

    [3] State Small Business Credit Initiative: A Summary of States 2016 Annual Reports, Washington D.C.: Department of the Treasury, 2017, https://home.treasury.gov/system/files/256/SSBCI-Summary-of-States-Annual-Report-2016_508-Compliant.pdf.

    [4]  Seidman, Ellen, “Capital Access Programs: CDFI Case Study on the California Capital Access Program,” Urban Institute, April 2018, https://www.urban.org/sites/default/files/publication/98051/capital_access_programs_cdfi_case_study_on_the_california_capital_access_programs_0.pdf.

    [5] Program Evaluation of The US Department of Treasury State Small Business Credit Initiative, Arlington, VA: Center for Regional Economic Competitiveness, 2016), https://www.treasury.gov/resource-center/sb-programs/documents/ssbci%20program%20evaluation%202016%20-%20full%20report.pdf.

    [6] Florida Opportunity Fund, “Florida Venture Capital Program,” https://www.floridaopportunityfund.com/florida-venture-capital-program/.

    [7] Haltiwanger, John C.,Jarmin, Ron S., & Miranda, Javier. Who Creates Jobs? Small Versus Large Versus Young. National Bureau of Economic Research. Working paper 16300. August 2010, revised November 2012. Web accessed. (http://www.nber.org/papers/ w16300.pdf).

    [8] Information and Observations on State Venture Capital Programs, Washington, D.C.: Cromwell Schmisseur LLC, 2013), https://www.treasury.gov/resource-center/sb-programs/Documents/VC%20Report.pdf

    [9] State Small Business Credit Initiative: A Summary of States 2016 Annual Reports, Washington D.C.: Department of the Treasury, 2017, https://home.treasury.gov/system/files/256/SSBCI-Summary-of-States-Annual-Report-2016_508-Compliant.pdf.

    [10] Program Evaluation of The US Department of Treasury State Small Business Credit Initiative, Arlington, VA: Center for Regional Economic Competitiveness, 2016), https://www.treasury.gov/resource-center/sb-programs/documents/ssbci%20program%20evaluation%202016%20-%20full%20report.pdf.

    [11] Overbey, Courtney, “MEDC Helps Small, Medium-Sized Businesses Access Capital in Michigan,” Michigan Economic Development Corporation, June 16, 2021, https://www.michiganbusiness.org/news/2021/06/medc-helps-small-medium-sized-businesses-access-capital-in-michigan/.

    [12] Program Evaluation of The US Department of Treasury State Small Business Credit Initiative, Arlington, VA: Center for Regional Economic Competitiveness, 2016), https://www.treasury.gov/resource-center/sb-programs/documents/ssbci%20program%20evaluation%202016%20-%20full%20report.pdf.

    [13] State Small Business Credit Initiative: A Summary of States 2016 Annual Reports, Washington D.C.: Department of the Treasury, 2017, https://home.treasury.gov/system/files/256/SSBCI-Summary-of-States-Annual-Report-2016_508-Compliant.pdf.

    [14] Program Evaluation of The US Department of Treasury State Small Business Credit Initiative, Arlington, VA: Center for Regional Economic Competitiveness, 2016), https://www.treasury.gov/resource-center/sb-programs/documents/ssbci%20program%20evaluation%202016%20-%20full%20report.pdf.

    [15] State Small Business Credit Initiative: A Summary of States 2016 Annual Reports, Washington D.C.: Department of the Treasury, 2017, https://home.treasury.gov/system/files/256/SSBCI-Summary-of-States-Annual-Report-2016_508-Compliant.pdf.

  • State Incentive Program Trends: Broadband Expansion

    To ensure equitable access to broadband internet and spur economic development in underserved communities, many states offer incentive programs to for-profit businesses, local governments, and/or non-profit organizations to expand broadband internet access throughout the state.

    The incentives can take a variety of forms. Some states offer specific tax credits relating to broadband infrastructure development, like the Mississippi Broadband Technology Tax Credit. In many states, infrastructure and investment programs that are not explicitly advertised as “broadband expansion programs” can be used to expand internet access and promote prosperity in all communities. States can also leverage federal programs, such as the Community Development Block Grant and New Markets Tax Credit, to assist underserved populations and ensure equitable internet access.

    Users of the C2ER State Business Incentives Database can find state programs offering tax credits to fund broadband infrastructure expansion, such as as rural economic development tax credits, opportunity zone investment tax credits, and other tax credits for job creation, broadband technology purchases, brownfield cleanup activities, and infrastructure development.

    Beyond tax credits, many states offer grant programs that can be used to spur broadband internet expansion, such as grants for enterprise zone property investment, infrastructure development, job investment activities, economic development, site development, and industrial development. Loan and loan guarantee programs are also utilized, including state programs offering industrial revenue bonds, capital revolving loan options, and/or enterprise bonds for broadband expansion.

    One innovative state approach includes the use of Community Development Block Grants (CDBG) to drive internet expansion in underserved communities. For example, in 2014, Nelson County, Virginia was awarded $200,000 in CDBG funds with a $100,000 Local Match Fund requirement. With the CDBG grant funding, Nelson County was able to construct approximately 8.1 miles of fiber optic cable in underserved areas of the locality. The beneficiaries of the fiber optic cable expansion included 88 businesses, 80 residential structures, and 20 newly created jobs resulting from the project.

    Another inventive state incentive program is the use of New Market Tax Credits (NMTC) to spur broadband internet expansion. Congress authorized the NMTC in 2000 to mitigate the cost of capital expansion in low-income communities. The program’s flexibility provides options to finance projects to expand broadband, according to the New Markets Tax Credit Coalition. For example, in Conneaut, Ohio, the Ohio Community Development Finance Fund partnered with the Development Fund of the Western Reserve and US Bancorp Community Development Corporation to provide NMTC financing in the town for broadband internet expansion. Conneaut, Ohio has been categorized by the Appalachian Regional Commission as a “severely distressed” and underserved community. But through the collaborative effort made possible by NMTC financing, the private business GreatWage Communications—a company providing high-quality telecommunications services in rural areas—was able to expand into Conneaut, Ohio, leading to 54 new jobs and expanded broadband internet access to an additional 50 businesses and 600 residential customers.

    There are many avenues for non-profit organizations, for-profit companies, and/or local governments to strategically use state incentive programs toward broadband internet expansion in their respective communities. The Council for Community and Economic Research (C2ER) maintains the State Business Incentives Database, where users can search and compare state incentive programs from all U.S. states and territories.

  • Regional Trends in Southern State Business Incentives Programs

    C2ER is in the process of completing its annual summer update of the State Business Incentives Database. The C2ER State Business Incentives Database provides users with data on 2,100 state business incentive programs from all US states and territories. Through a regional analysis of incentive programs in the Southern US, we can understand how geography and regional competition shapes trends in incentives programs.

    Southern States Included in Analysis


    Program Business Needs

    Business Need Southern States National
    Business Management 2.8% 7.8%
    Capital Access or Formation 26.1% 75.8%
    Facility/Site Location 11% 32.7%
    Infrastructure Improvement 10.3% 21.3%
    Marketing & Sales Assistance 1.7% 6.6%
    Product & Process Improvement 6.8% 21.9%
    Professional Networking 0.8% 3.1%
    Tax/Regulatory Burden Reduction 27.5% 71.2%
    Tech & Product Development 4.9% 14.2%
    Workforce Prep and Development 7.3% 19.3%
    Other 0.7% 2.8%
    Note: Programs may have multiple business needs.

    Program business needs in the South generally reflect national trends, with the most programs categorized as capital access or formation programs, facility/site location, and tax/regulatory burden reduction. There are a significant number of programs that also fall under the infrastructure improvement category.

    In general, national programs top business needs include capital access or formation, tax/regulatory burden reduction, and facility/site location. For Southern states, we also see infrastructure improvement as a business need that many incentive programs fall into.

    Southern states’ business incentives packages typically include historic rehabilitation tax credits, grants and loans for rural development, and tax credits for manufacturing. Businesses rehabilitating properties listed on the National Register of Historic Places qualify for a 20% federal-income tax credit on qualified expenditures. On top of the federal tax credit, every Southern state offers an additional state-income tax credit between for rehabilitation, with 8 states offering a 25% tax credit. Delaware further offers a 30% tax credit for qualified rehabilitation costs for non-profits, and Kentucky offers a 30% credit for owner-occupied residential properties. Almost 40% of historic places are in the South.

    Incentives in the Southern states also focus on encouraging business expansion and relocation through targeted incentives for job creation. Headquarters relocation incentives offer credits against corporations’ state tax liability to offset costs associated with the relocation of a company’s headquarters to the state, including moving and the purchase or replacement of equipment. Georgia’s Quality Jobs Tax Credit provides a state-income tax credit of up to $5,000 per new job that pays over the average state wage. Oklahoma’s Quality Jobs Program provides a cash rebate of equivalent to 5% of payroll for 10 years for businesses that expand and create new jobs in the state. These programs are designed to create high-paying jobs and increase investment in the state through offsetting the costs associated with relocation and job creation.

    Southern states commonly offer incentives programs to support defense communities that host military installations, service members, and their families or are suffering from the recent closure of an installing. With a large concentration of military bases located in the South, such programs are especially vital to the region. Texas, which hosts the second largest number of military bases in the US, offers grant and loan programs to communities support those that were positively affected by Department of Defense decisions, such as new or expanded military missions, or communities negatively affected, those recovering from a reduction or termination in defense contracts. The Georgia Military Zone Job Tax Program provides a $3,500 per job tax credit to businesses that create at least 2 new jobs in high-poverty census tracts adjacent to military installations. These incentives not only support those businesses that may employ families of service members, but also encourage economic development in and around defense communities.

    Users can use the incentives database to identify regional trends, especially those that will be relevant to their own economic analyses. Please contact C2ER if you are interested in the data or if C2ER can help facilitate a regional analysis.

  • 2017 C2ER Accomplishments

    During the past 12 months, the Council for Community and Economic Research, YOUR professional membership organization, has been hard at work increasing the visibility of economic, workforce, and community research by advocating for higher quality data, promoting more focused public and private investments in local data, and continuing to strengthen C2ER products and services.  We keep you informed about new data sources, exciting research, and opportunities to learn.  Following are some of the most vital accomplishments during the past year.

    Communication with Data Users and Producers

    Publications: C2ER/LMI Institute Weekly Update and Journal

    • Modernized the weekly Update with a fresh look
    • Monitored and summarized emerging data issues, relevant events, and recent research
    • Distributed weekly Update to more than 8,000 individuals, including members and targeted stakeholders
    • Developed target updates to non-members to increase membership rates among current readers
    • Published blog posts on topics relevant to C2ER members, including C2ER events and economic development news and trend analysis (https://blog.c2er.org/)
    • Produced four specialized blog-formatted articles for the Journal of Applied Research in Economic Development on relevant issues to economic development analysts and practitioners

    Annual Conference, Training and Certification

    • Coordinated C2ER Annual Conference, LMI Institute Annual Forum and the Projections Managing Partnership (PMP) Summit for more than 240 attendees
    • Delivered in-person training courses:

    Basic Labor Market Information Analyst

    Foundations of Applied Economic Development Research

    Intermediate Tableau for Economic and Workforce Developers

    Leadership in Research Workshop

    Analyzing & Developing Workforce Studies

    New Census Tools 101

    Applied Analyst Training

    • Conducted 24 webinars, reaching over 2,000 audience members
    • Certified three new Certified Community Researchers (CCR) in Quarter 4, 2017

    Data Advocacy and National Visibility for C2ER Member Efforts

    • Served as member of BLS Data Users Advisory Committee
    • Collaborated with Friends of BLS and the Census Project in federal statistical advocacy efforts
    • Met periodically with key Census, BLS, and BEA leaders to improve regional data access
    • Represented the interests of statistical data users in meetings with Congressional staff during several visits to Capitol Hill, including organizing C2ER volunteers to contact Congress
    • Signed on to several letters advocating for proper funding for Census, BLS, and BEA
    • Provided input and technical assistance to the Commission on Evidence-Based Policymaking

    Data Collection and Research Activities

    Cost of Living Index – C2ER’s flagship data product since 1968   http://www.coli.org

    • Remodeled and issued 2017 County and State Level Cost of Living Index
    • Improved the process of library application and added three non-COLI databases including the State Business Incentives Database, State Economic Development Program Expenditures Database, and C2ER Diversity Index Database
    • Conducted online data scraping for housing, grocery, and miscellaneous categories nationwide
    • Attended annual conferences for the American Library Association, Tableau, and Emsi to promote C2ER products and membership
    • Increased metro participation with eight new communities contributing data

    C2ER State Business Incentives Database Update http://www.stateincentives.org/

    • Maintained and updated unique summary of around 1,800 state programs designed to help businesses create jobs with 2017-2018 state legislative changes
    • Added additional programs for all U.S. states, territories, and the District of Columbia
    • Renewed the partnership with SelectUSA at the U.S. Department of Commerce to provide content to international companies seeking U.S. facility locations
    • Updated the program manager contact list based on state agency feedback

    C2ER State Economic Development Program Expenditures Database Update  http://www.stateexpenditures.org

    • Updated database for FY 2018 proposed expenditures, as well as FY 2016 actual and FY 2017 appropriated expenditures (when available), for all 50 states in the database
      • Updated 2,300 and added 1,100 more state economic development program expenditure records

    Other Policy and Economic Research and Technical Assistance

    • Continued partnership on a two-year project on state data sharing laws, regulations and agreements for a project sponsored by Laura and John Arnold Foundation
    • Assisted National Association of State Workforce Agencies (NASWA) with assessing the data analytic opportunities from the National Labor Exchange database of job openings data
    • Provided state incentives information to the U.S. Dept. of Commerce SelectUSA program
    • Conducted research on Current Population Survey microdata about the prevalence of credentials by education level, occupation, and other workforce characteristics
    • Launched the C2ER Tools of the Trade Database, an online resource for economic and workforce developers to identify data resources to guide their research
  • State of State Business Incentives 2015

    State of State Business Incentives 2015

    C2ER recently completed its annual update of the State Business Incentives Database. As part of the database review process, C2ER researched every U.S. state and territory to ascertain information on what programs have been created, repealed or altered during each state’s most recent legislative sessions. Based on this research, combined with extensive outreach to representatives in every state and territory, the Database now reflects the present status of the more than 1,900 state business incentives in operation around the country.

    The State of State Business Incentives 2015 report summarizes the findings from this review. Most striking is the overall growth in the number of state business incentive programs. Since the new millennium, the overall number of state incentive programs targeted to businesses has more than doubled, from less than one thousand in 1999 to nearly two thousand today. The report takes a closer look at the different types and purposes of business incentive programs administered by states and how state incentive portfolios have changed over the past few years in response to recent economic trends, with notable examples of recent state incentive activity.

  • Illinois’s State Budget Impasse

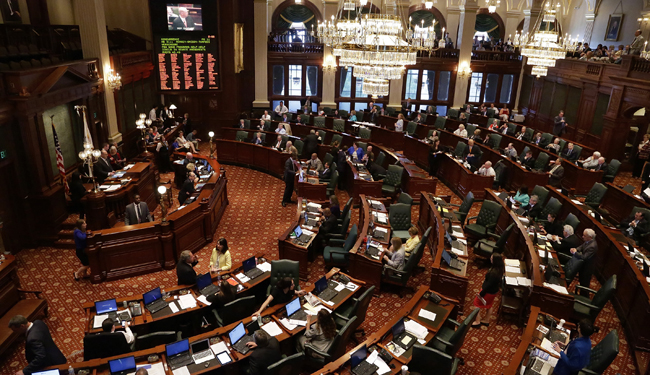
    Passing the annual budget is often a difficult task for state governments, particularly during lean fiscal periods. Over the past few months, Illinois has found resourceful ways to avoid a complete government shutdown after not passing their annual state budget.

    The state is making its way through the second month of the fiscal year without a budget. Previously created laws and court decisions require funding to continue for about 80% of state spending, including paying state employees and Medicaid bills. However, many of Illinois’s economic incentive programs have been suspended as the state deals with no full year plan for spending.

    Governor Rauner wanted a substantially reduced budget compared to what was passed by the General Assembly in June. The General Assembly’s proposed budget had revenue increases to fix the state’s current deficit, which Governor Rauner was open to if changes were made to workers’ compensation, civil lawsuit damage award limits, and public union bargaining and contracting rules, as well as a freeze on property taxes. Two months later, neither side seems much closer to an agreement. A small sign of progress occurred August 12 when the State House agreed unanimously to free $5.2 billion in federal funding that had been unavailable since July 1st because no budget has been passed.

    While the federal funding will help, 20 percent of recently surveyed state social service providers will run out of money in the next few weeks. Along with economic development programs, state universities are also part of the list of organizations not getting funding. ReBoot Illinois has created a continually updating map of people and organizations that have been impacted by the budget impasse.

    Newly-elected Governor Bruce Rauner has wrestled with how best to handle state business incentive programs. In April, the Rauner administration lifted the spending freeze it placed upon $100 million in business tax incentives for the state’s Economic Development for a Growing Economy (EDGE) program. The EDGE program provides tax credits to corporations to encourage the businesses to expand their operations in Illinois. To help reduce the state’s current deficit of $4 billion, at the start of June Governor Rauner suspended the application process for any future economic incentives used to attract and grow businesses. These programs have yet to be reactivated.

    Illinois’s unusual situation is risky for the state’s economic future if funding for key state economic growth programs continues to stay low. The state’s credit rating will likely be downgraded soon and Illinois was recently ranked last in financial health by the Mercatus Center at George Mason University. Although no end appears to be in sight, Illinois will eventually have to pass a budget or else face running out of money completely. Until then, the future of Illinois’s business incentive and other economic development programs remains uncertain.

  • Good Programs Destroyed by Bad Evaluations

    Good Programs Destroyed by Bad Evaluations

    This is a guest blog post by Dr. Catherine Searle Renault, Principal and Owner of Innovation Policyworks LLC, and Research Fellow at the Center for Regional Economic Competitiveness, where she specializes in evaluation research. 

    Who can argue with the importance of understanding whether or not taxpayer dollars are being used effectively to meet agreed upon policy goals like economic growth? Across the country, the concept of regularly evaluating economic development incentives, including those implemented as tax credits, is broadly accepted. The devil, however, is in the details. The best evaluations follow recognized policy evaluation and data analysis methodologies and principles.

    In Oklahoma and Maryland, the statutory evaluation is in the hands of evaluation professionals in the economic development agencies, rather than being delegated to a watchdog or audit organization, as is proposed in some states. This ensures that the evaluations are credible and professionally done, and actually answer the questions that the legislatures and the public have. (more…)

  • New State Business Incentives Glossary

    New State Business Incentives Glossary

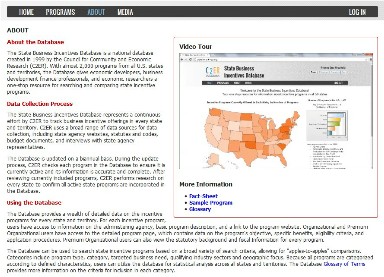
    Users of the C2ER State Business Incentives Database have a new resource for understanding some of the tricky terminology used to describe state business incentives. The Database now features a full Glossary with information on every term utilized in the Database.

    The Glossary provides information on the most commonly used terms used to describe state business incentives. Researchers can turn to this resource to find more information about different types of incentives, the various business needs fulfilled by incentives, and the statutory and fiscal background of programs. The Glossary also gives more insight into how C2ER researchers decide which incentive programs to include in the Database. (more…)

  • New State Business Incentives Analysis Tools

    New State Business Incentives Analysis Tools

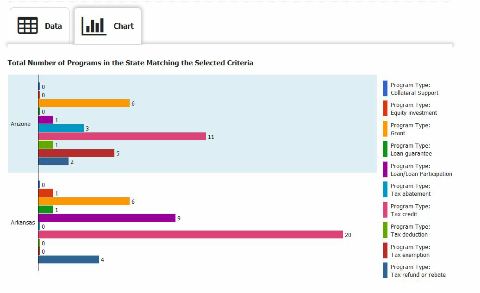
    C2ER is pleased to announce two new analysis tools for the State Business Incentives Database. Researchers using the new State by State and Totals by State analysis tools will now find it much easier to make “apples-to-apples” comparisons between incentives projects. (more…)

  • C2ER Partners with SelectUSA

    C2ER Partners with SelectUSA

    C2ER and SelectUSA have entered into a partnership to make some features of the State Business Incentives Database publicly available through SelectUSA.gov. SelectUSA is an initiative housed in the U.S. Department of Commerce that was established to attract and retain investment in the American economy. This initiative provides investors with information on accessing federal and state programs and services related to business investment. (more…)