COLI BBQ Index: Supply Chain Disruptions and the Meat Industry
The Cost of Living Index, published by C2ER since 1968, tracks data on living cost differentials among U.S. urban areas, including meat. Using the Quarter 2, 2021 prices of ribeye steak, ground beef, pork sausage, and chicken, a BBQ index was constructed to signify which metro areas and states are relatively more or less expensive. The map below is a visual representation of that index. The darker the shade, the higher the index. 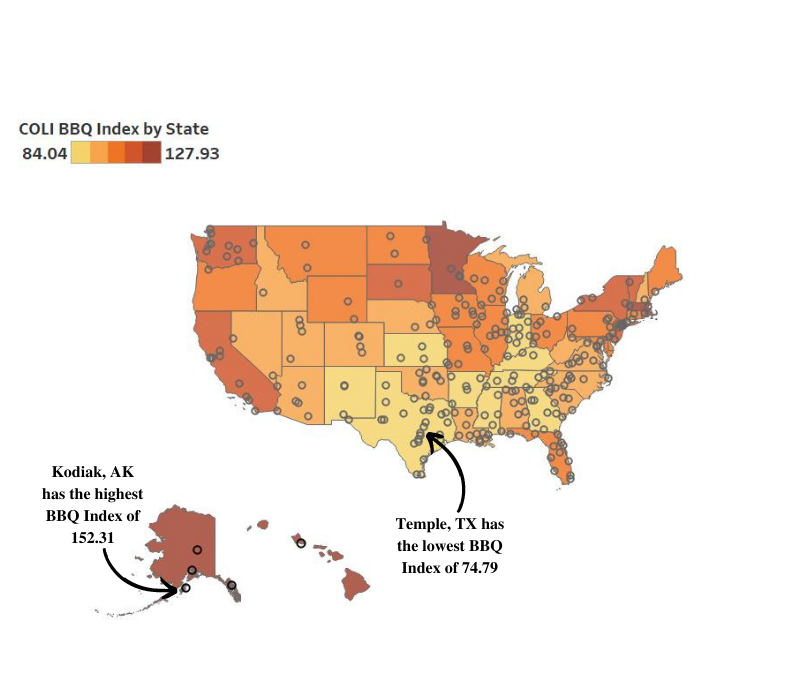
Click here to access the interactive COLI BBQ map
Alaska ranks as the most expensive state to purchase meat products and Mississippi as the least. Tracking the most current differentials for meat products is only a snapshot of the market for meat right now. Thus, it is also critical to track the prices of meat products over time.
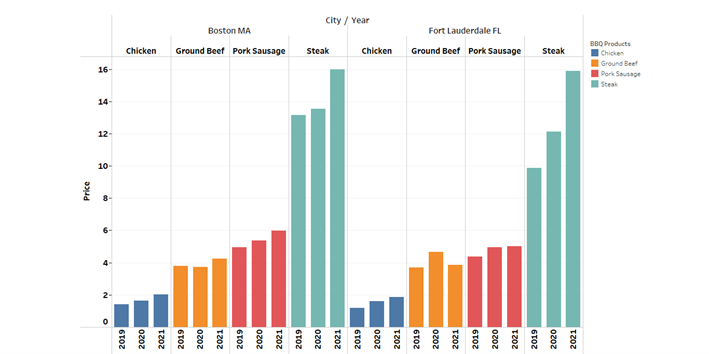
Kodiak, AK and Seattle, WA had the highest COLI BBQ Indices for Q2 of 2021, but Fort Lauderdale, FL and Boston, MA prices increased by 35% and 25%, respectively, on average across each item since 2019. This rate of change far surpasses inflation by about ten-fold. Meat product prices decreased in a select group of cities, but the rate at which prices decreased for those cities was nowhere near the magnitude in price increases experienced in many other cities. Of the 234 cities that COLI tracked in both 2019 and Q2 of 2021, prices increased by more than 5% in close to half of them and prices increased by more than 10% in about a fifth. The bar graph below shows the increase in prices across each BBQ product for Boston and Fort Lauderdale since 2019.
Access the interactive bar graph by clicking here to view changes in prices across each metro area, using the graphs drop-down filter function.
As the impacts of the pandemic on supply chains dissipate, price corrections are foreseeable. Hopefully, by this time next year, BBQ activities can resume at more affordable prices. To learn more about other products or how your organization can become a data collection participant for the Cost of Living Index visit coli.org.